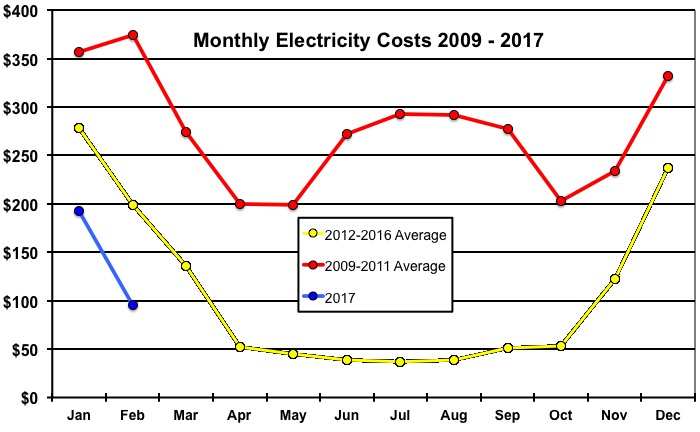
Performance
The
graph below shows our monthly electricity costs for 2017 (blue line)
plus costs averaged over years
2009 through 2011 prior to
solar system installation (red line), and costs averaged for years 2012
through 2016 after installation (yellow line). Numbers are taken from
CPS
billing statements and include not only charges for power used, but
also CPS fixed charges, City of San Antonio service fees, and taxes. In
2016 these added fees totaled about $24, and set a minimum for the
monthly CPS
bill.
Comparison of total costs over time is not straightforward because of
changes in rates and other fees. However imprecise, the graph indicates
that the solar power system provides substantial savings: the average
annual cost for years 2009 - 2011 (prior to installation) was $3,308,
while average annual cost for 2012 - 2016 was $1,288. This is an
average
savings of $2,021, or about 61% of the costs before the system was in
place.
Based on current electric rates, the payback period for our initial
investment is about 10 years from the date of installation.