USING THE RAINWATER HARVEST ESTIMATOR
The Rainwater Harvest Estimator is a Microsoft Excel workbook consisting of two linked spreadsheets. Daily rainfall amounts are the only fixed values in the workbook – all other input consists of variables that may be set as desired by the user. Some numerical output values are generated, but the most useful output will be the graph of daily storage levels indicating the overall success and shortcomings of the combined effects of all input values.
PLEASE NOTE: I have done my best to check the accuracy and validity of the data and calculations in this workbook, but I must assert the usual disclaimer that it is distributed without warranty, and that you use it at your own risk.
1. The Analysis spreadsheet consists of a graph and two panels.
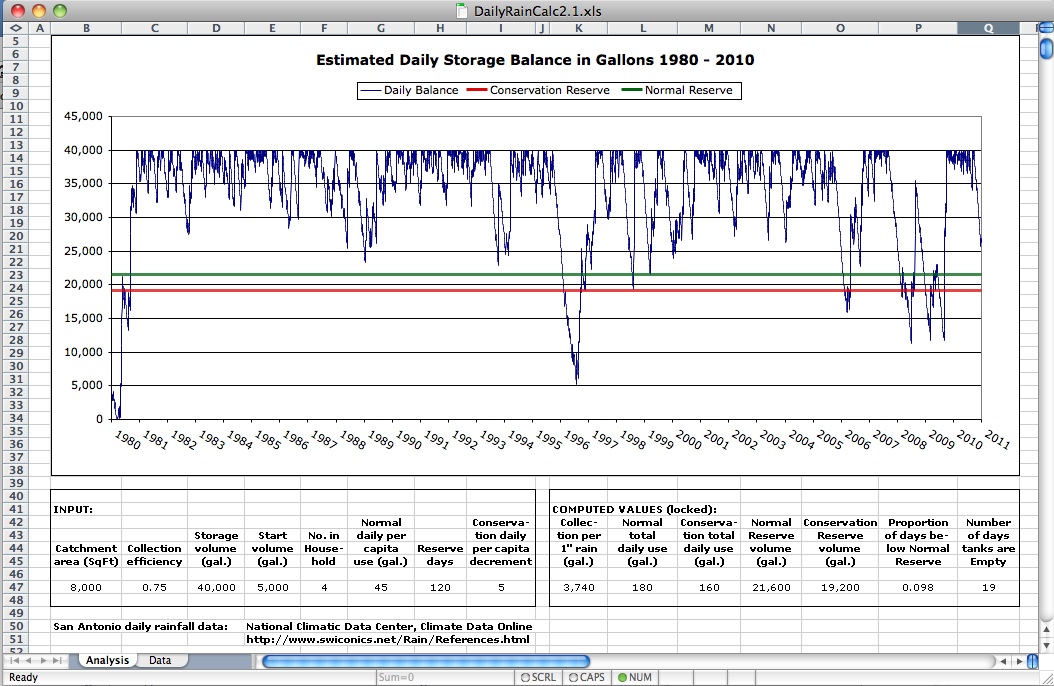
The graph (Estimated Daily Storage Balance in Gallons 1980 – 2010) shows water storage levels by day for the input variables selected over the entire time period analyzed. Horizontal lines depict Normal Reserve volume (green), and Conservation Reserve volume (red).
![]()
• The INPUT panel is where variables are set:
| Catchment area | This is the footprint area of the building, plus horizontal roof overhang (soffit area, etc.). |
| Collection efficiency | This differs depending on roofing material, slope of roof, gutter size, etc. Typically set between 70% and 90%. |
| Storage volume (gal.) | This is the total capacity of tanks or cistern. |
| Start volume (gal.) | This is an arbitrary amount of water in storage at start of collection. This water may have come from rain, purchase, or well. |
| No. in Household | Number of permanent residents who depend on this water supply. |
| Normal daily per capital usage (gal.) | This varies with lifestyle, landscape watering, number of appliances, etc., but is often estimated at 35 – 45 for water-conserving households (see Rainwater Harvesting Potential and Guidelines for Texas 2006, page 10). |
| Conservation daily per capita decrement | This is an arbitrary amount (in gallons) by which each individual in the household reduces daily water usage when storage dips below Normal Reserve volume. |
| Reserve days | This is an arbitrary number of days during which water supply should last without rain or other replenishment. |
![]()
• The COMPUTED VALUES panel contains values calculated from INPUT entries:
| Collection per 1" rain | This is an estimate of the volume of water that can be collected from the daily rainfall in inches, the given catchment area, and the estimated collection efficiency. |
| Normal total daily usage (gal.) | This is the calculated volume of water consumed, based on the Normal per capita usage of all household members for one day. |
| Conservation total daily usage (gal.) | This is the calculated daily volume of water consumed by all household members when per capita usage has been decremented in response to storage levels below the Normal Reserve volume. |
| Normal Reserve volume (gal.) | This is the calculated volume of water required to maintain a supply for the number of Reserve days specified, based on Normal daily per capita usage of all household members. |
| Conservation Reserve volume (gal.) | This is the calculated volume of water required to maintain a supply for the number of Reserve days specified, based on Conservation daily per capita usage of all household members. |
| Proportion of Days below Normal Reserve | This is the number of days in which storage levels fall below the Normal Reserve volume, divided by the total number of days analyzed. |
| Number of Days Tanks are Empty | This will be a useful measure only for small systems that do not need to provide an uninterrupted supply of water. |
![]()
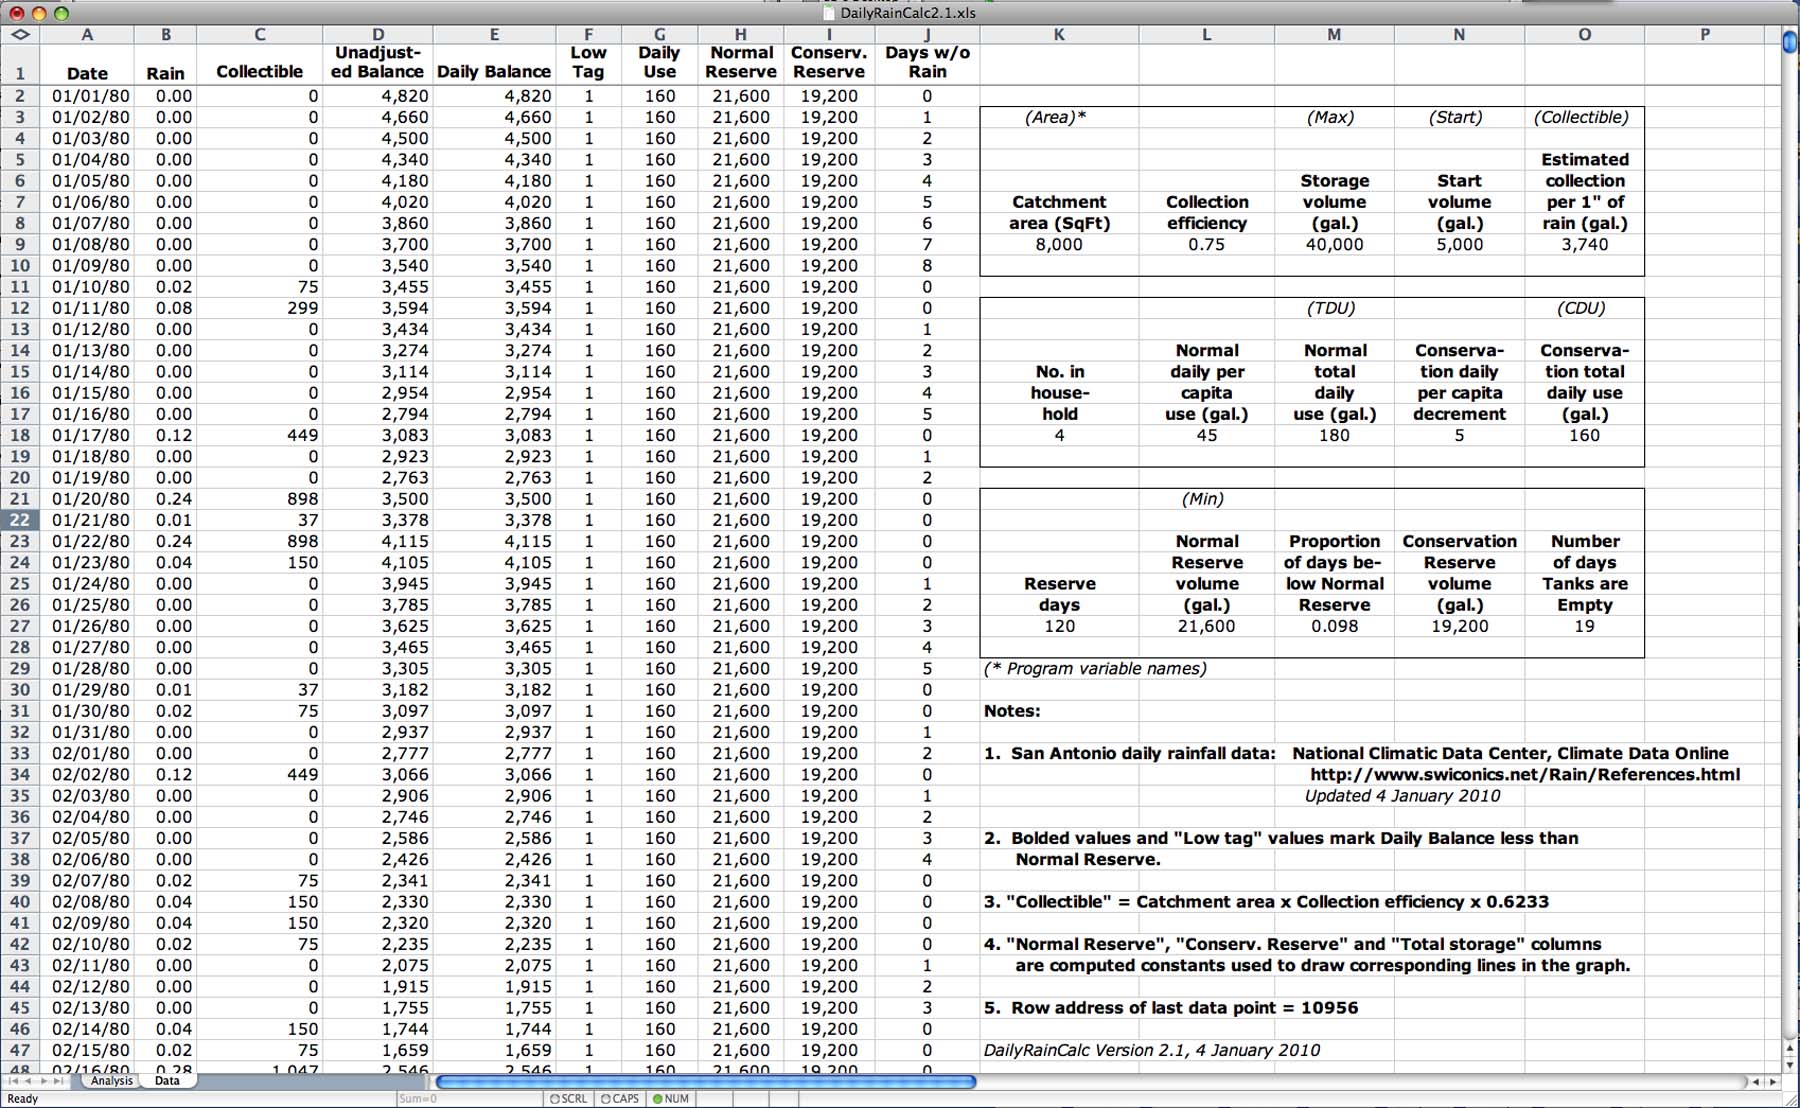
2. The Data spreadsheet contains the basic San Antonio area daily rainfall data (Date and Rain columns), seven additional columns of derived values, summary tables similar to those on the Analysis spreadsheet, reference material, and some programming information.
![]()
The Data spreadsheet and all but the variables in the left-hand INPUT panel of the Analysis spreadsheet are locked. Unless you want to modify the programming or the rainfall data, you should not need to bother much with the Data spreadsheet.
![]()
The Analysis spreadsheet (showing the graph) should appear when the workbook is first launched. If it does not, that is, if the Data spreadsheet appears (showing just numbers and text), click on the Analysis tab at the very bottom left of the spreadsheet window.
![]()
The San Antonio rainfall data used in this workbook were downloaded from NOAA's National Climatic Data Center (see References). We chose 1980 as the starting point for this series.
The climatological past is only imperfectly predictive of the future: rainfall amounts are inherently variable, and indications are that we are entering a period of climate change. The data used constitute a limited sample of available measurements, but they do cover a wide range of climate experience, including the drought periods of 2008 and 2011. The data thus give us a starting point for sizing a rainwater harvest system – at the very least one that would not have failed to deliver an adequate volume of domestic water in the recent past.
![]()
Enter appropriate figures for catchment area, storage volume, etc. in the INPUT panel.
Catchment area is measured as a horizontal "footprint" of the roof. It is usually measured as the area circumsubscribed by the outer dimensions of the building foundation, plus overhang areas such as soffits, porches, etc. It is not the area of the roofing material itself if the roof is not flat.
Unless you have better information, Collection efficiency is usually assumed to be 0.7 – 0.8.
The Start volume variable is of minor importance, indicating only that one must have an auxiliary source of water at startup until storage reaches the point where it can tolerate sustained water usage over periods of little or no rainfall.
The most conservative estimate of Reserve Days (120) is based on the 1950s drought of record. Feel free to use any value you like if you feel this is too much.
The Conservation daily per capita decrement assumes that household members would reduce their water usage at some point before storage reaches dangerously low levels. For the time being, the trigger level is set at Normal Reserve volume.
Varying your entries and observing the graph and numbers in the right-hand COMPUTED VALUES panel (that is, "playing around") should begin to give you an idea of your proposed system capabilities.
![]()
Download the Rainwater Harvest Estimator (MS Excel file)
![]()
swiconics@swiconics.net
Notes for Version 2.1
January 4, 2010