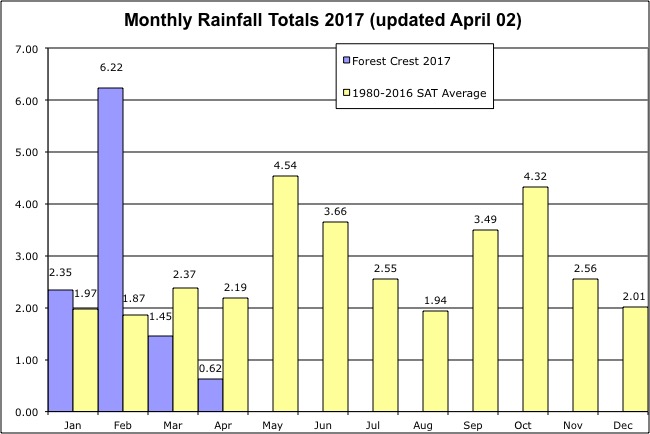
The graph below shows monthly rainfall totals in the Forest Crest
subdivision for 2017 (blue bars), compared with monthly San Antonio
averages for the years 1980 through 2016 (yellow). Forest Crest
measurements are from a Davis Vantage Pro 2 weather station adjacent to
the Camp Bullis area.
Note: Numbers for years 1980 -
2010 are based on data from
weather station KSAT at the San Antonio International Airport which
were downloaded from NOAA's National Climatic Data Center. Subsequent
years are based on Forest Crest measurements which may differ slightly
from official KSAT numbers.
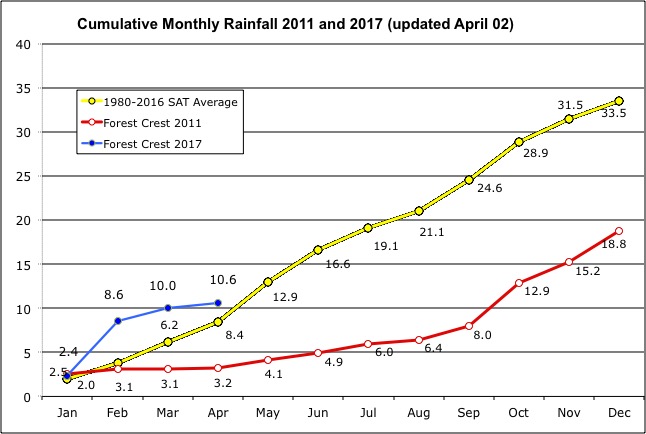
The graph below shows cumulative monthly rainfall totals in the
Forest Crest subdivision for 2017 (blue line), compared with monthly
San Antonio averages for the years 1980 through 2015 (yellow). For
contrast, monthly Forest Crest totals for drought year 2011 are shown
in red.
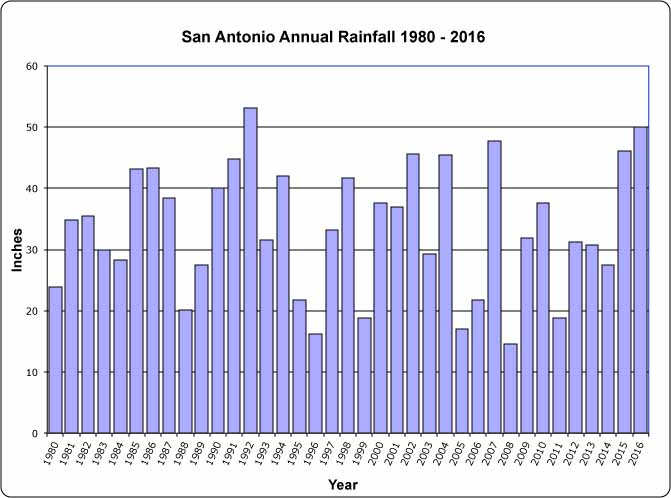
Rainfall in South Texas is highly variable from year to year. Over
the past 34 years, annual totals have been as much as 53.1" in 1992 and
as little as 14.6" in 2008. The table and graph below give totals for
each year from 1980 through 2016.
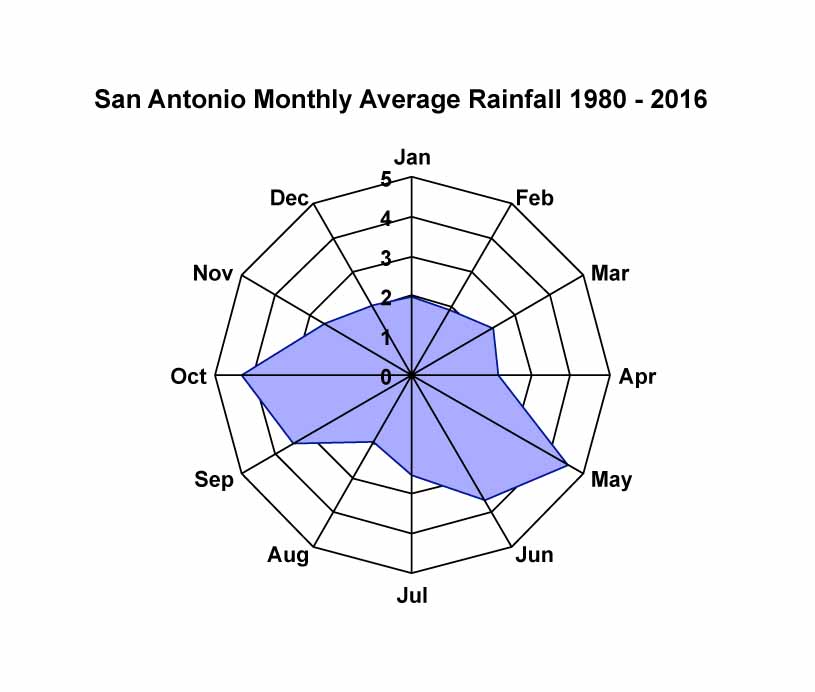
Likewise, rainfall amounts are variable from month to month in any
given year. May - June and September - October tend to be the peak
months, with considerably less during the rest of the year. This can be
seen in the graph below.
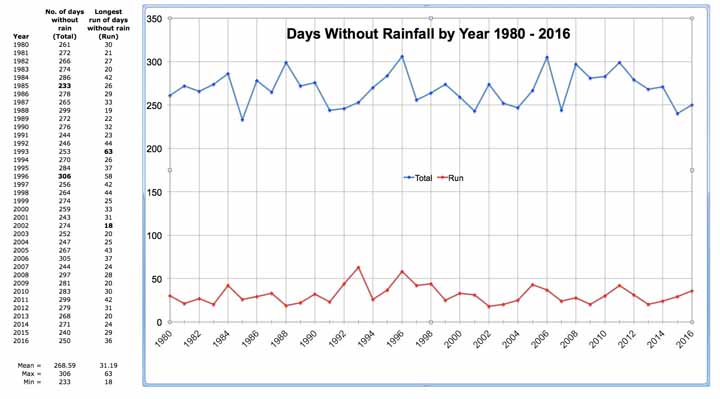
The interval between rainfalls can be quite long even when the annual total is high. The table and graph below give both the total number of days without rain, and the longest run of consecutive days without rain for each year from 1980 through 2016.