COLLECTING INFORMATION
To complete the information required to plan our storage capacity, we needed an estimate of our projected water usage. To assess our current use, we tallied past years' city water bill information. This turned out to be somewhat more complicated than expected, because our water usage declined over the years as we updated our inefficient and leaky plumbing and as we became more conscious of the need not to waste. Per capita usage ranged from more than 100 gallons per day in the 1980s, to about 55 in 2005 – 2008.
It was also necessary to estimate the amount of water used by various appliances and activities to show where water savings might be applied. This required reviewing technical specifications, and a rather tedious round of reading the water meter before and after showers, clothes washing, landscape watering, etc. The table below summarizes information about appliances (gpu = gallons per use; gpm = gallons per minute).
| Appliance | Old | New |
| Dishwasher | 13.5 gpu | 2.4 – 5.9 gpu |
| Laundry | 40 – 50 gpu | 12 – 15 gpu |
| Toilets | 3.5 gpu | 0.9 /1.6 gpu (dual flush) |
| Shower heads | 5.5 gpm | 1.5 gpm |
| Bathroom faucets | 4 – 7 gpm | 1.5 gpm |
| Kitchen faucets | 4 – 7 gpm | 2.5 gpm |
Another result of our measurements was the realization of how much was wasted by letting faucets run until the water became hot, especially those that were located furthest from the hot water heater. It became clear that a recirculating system would be required to correct this problem.
On the basis of these estimates and the knowledge that our new appliances would be more efficient than the old, we estimated that a reasonable per capita goal would be 45 gallons per day.
DETERMINING STORAGE REQUIREMENTS
It was at this point that we turned to the Rainwater Harvest Estimator.
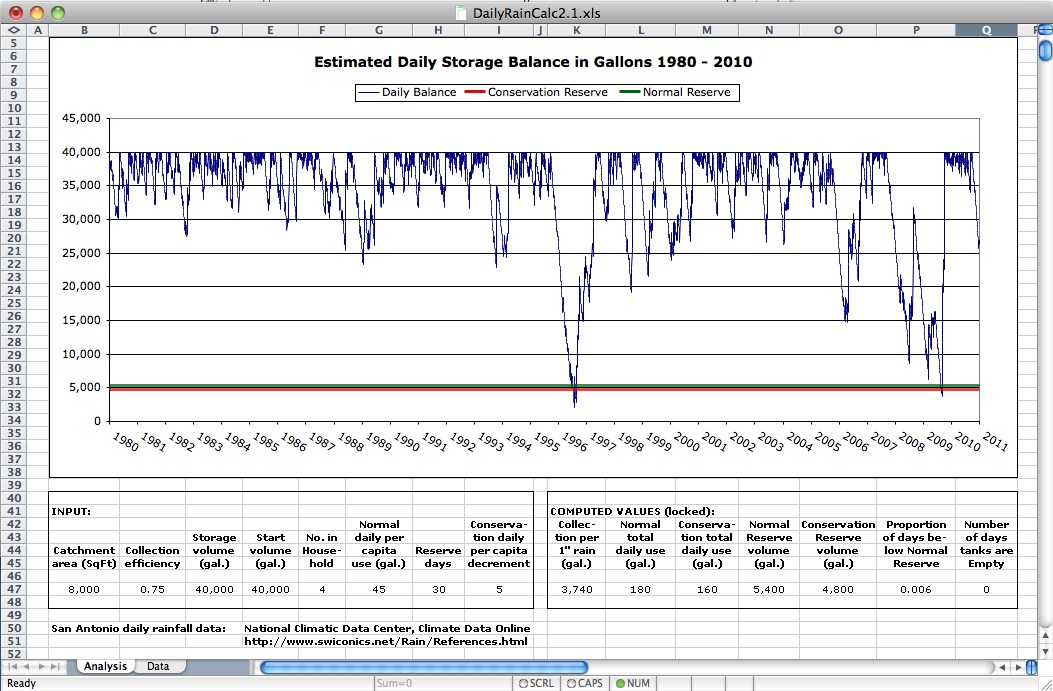
After considerable experimentation, we concluded that 40,000 gallons of storage was an acceptable compromise between cost and continuity of supply:

At first glance, it looks as if there would have been serious shortages in 1996, 2006, 2008 and 2009 at these input values. To get a better sense of how serious these shortages might have been, we reduced the Reserve days to 30. Except for the Start volume which was set at 40,000 gallons to eliminate the effects of startup shortages, all other input values were unchanged:
Here we can see that without serious efforts at conservation, only in 1996 and 2009 would we have had less than a month's supply of water. Next, we examined the effect of conservation by returning to the 120-day reserve and varying the Conservation daily per capita decrement:
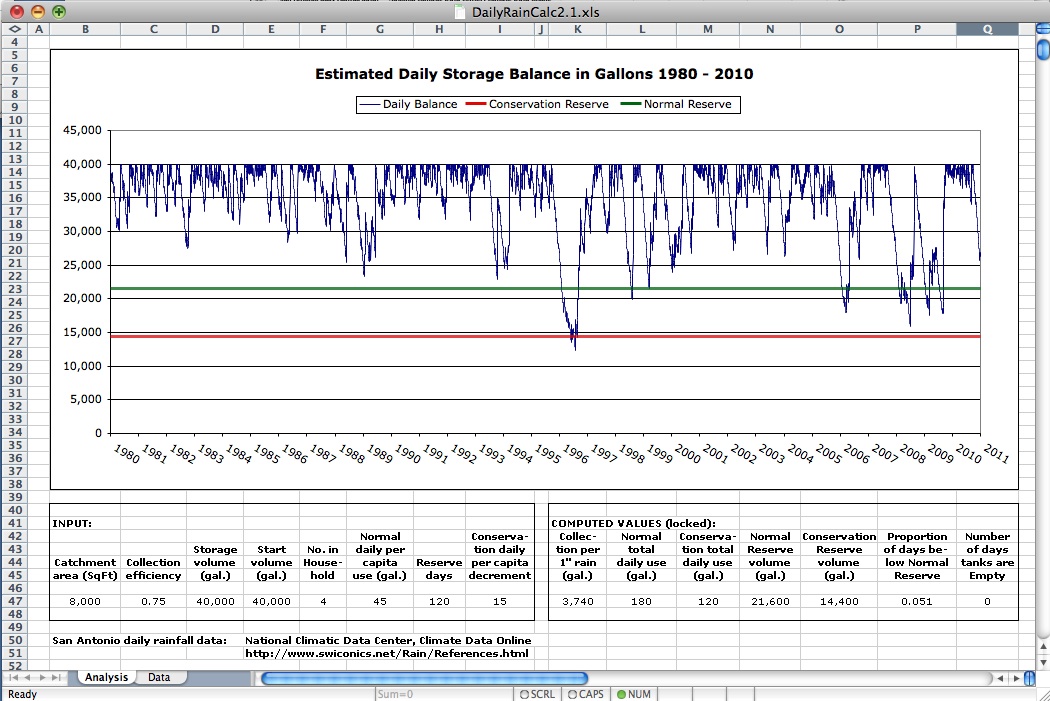
We show here the result of a 15 gallon decrement imposed when storage decreases below the level required to maintain supply for 120 days without rain. Based on our experience and on reports from other rainwater harvest installations, the resulting 30 gallon per capita daily usage is not likely to be a burdensome conservation goal. Note that even when supply was at its minimum in 1996, there remained 12,300 gallons or about 68 days of usage before storage would go completely dry.
From an extended series of experiments of which those shown here are a sample, we were confident that 40,000 gallons of storage would be acceptable. Our actual experience has shown this to be correct.