OVER TIME
Chemistry
The table below compares the general chemistry of our water as tested in 2011, with SAWS water sampled from the Edwards Aquifer during the years 2009 - 2011:
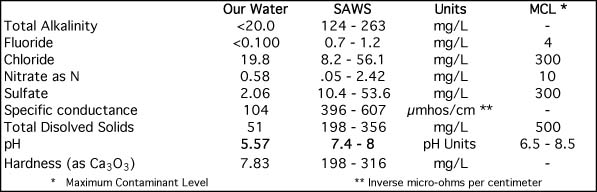
From this table we can see that our rainwater is markedly lower in mineral deposits than SAWS water. Its slight acidity (pH = 5.57) is due to carbon dioxide absorbed by atmospheric water -- a typical feature of rainwater. These properties give rainwater its superior taste, and eliminate the problem of corrosion and mineral residue in pipes and plumbing fixtures.
Bacteriology
• We have our water tested by the San Antonio Metropolital Health District laboratory which tests for Escherichia coli and total coliform bacteria.
• E. coli is absent from non-potable water sampled directly from the storage tanks, but this source tests positively for coliform bacteria, which is normal for water collected from exposed roof surfaces.
• Biannual tests of potable water (filtered and sterilized) since the first one done in December 2008 have consistently been negative for both E. coli and all other coliform organisms.
Maintenance
• We initially changed potable water filter cartridges every six months. But finding that there was no measurable pressure drop across filters, we increased the interval between changes to eight months.
• We replace the UV sterilizer lamp once a year.
• Pressure drop across the circulating filter (at the back of the pump house) has been minimal and the cartidge itself does not seem to accumulate much particulate matter. Consequently, we have used this filter only during extended periods without rainfall on the assumption that the stream it produces helps to aerate water in the tanks. It is not clear how important this may be.
• We do a weekly inspection of tank exteriors and exposed piping, checking to make sure the pump house and tank hatches are locked and that there are no leaks.
As a consequence of these inspections, we discovered in April of 2012 that a fitting on one of the aqueduct pipes had broken. This fitting was put in place in order to make a slight turn in the pipe:
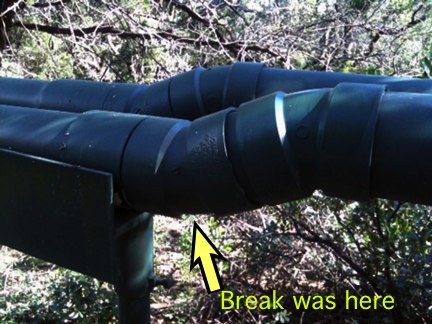
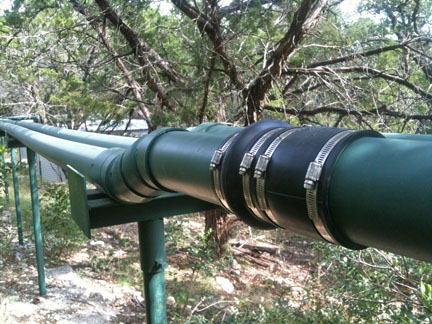
We will see if this arrangement survives a full year of temperature changes.
Usage
The table below shows our water use from January 2009 through the end of October 2012, by year, month and day:
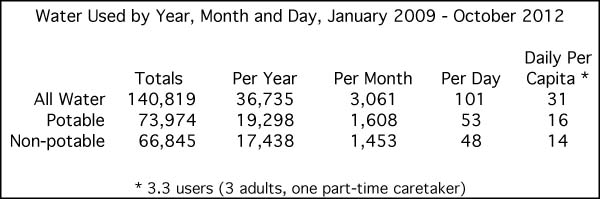
The table does not reflect variation over time, but detailed analysis reveals that whereas potable water use remains relatively constant over all time periods, non-potable use changes, principally reflecting differential landscape watering requirements.
Storage Tank Volumes
The lowest recorded storage tank level occurred during the 2011 drought year when the volume declined in July to about 24,000 gallons, or 66% of total capacity. It is evident that our system is turning out to be robust in the face of South Texas droughts.
The Surprising Effects of Light Rainfall
Even during periods of drought there are occasional light rainfalls. For example, during the drought year 2011 our rain gauge recorded 42 days of rainfall less than a fifth of an inch (0.01 - 0.19 inches, with an average of 0.058 inches). Because of evaporation and upper soil absorption, these light rains had practically no effect on declining aquifer levels or the public water supply, but they contributed an average of 217 gallons per rainfall (37 - 711 gallons) to our water tanks for a total of about 9,125 gallons, or enough to supply four people for about 74 days at our level of usage (31 gallons per capita).
Nothing beats heavy rain, but when harvesting rainfall every little bit truly helps.