The
Cost of Hot Water Recirculation
As mentioned on the DATA COLLECTION and PLANNING section of our
rainwater collection page, we noted that a considerable amount of water
may be wasted when running a faucet until it flowed hot. To eliminate
this
waste, we installed a recirculating loop and small pump in the hot
water plumbing. When the pump is running, water in the hot water line
never cools off and hot water runs from hot water faucets in a few
seconds rather than minutes, saving many gallons each day.
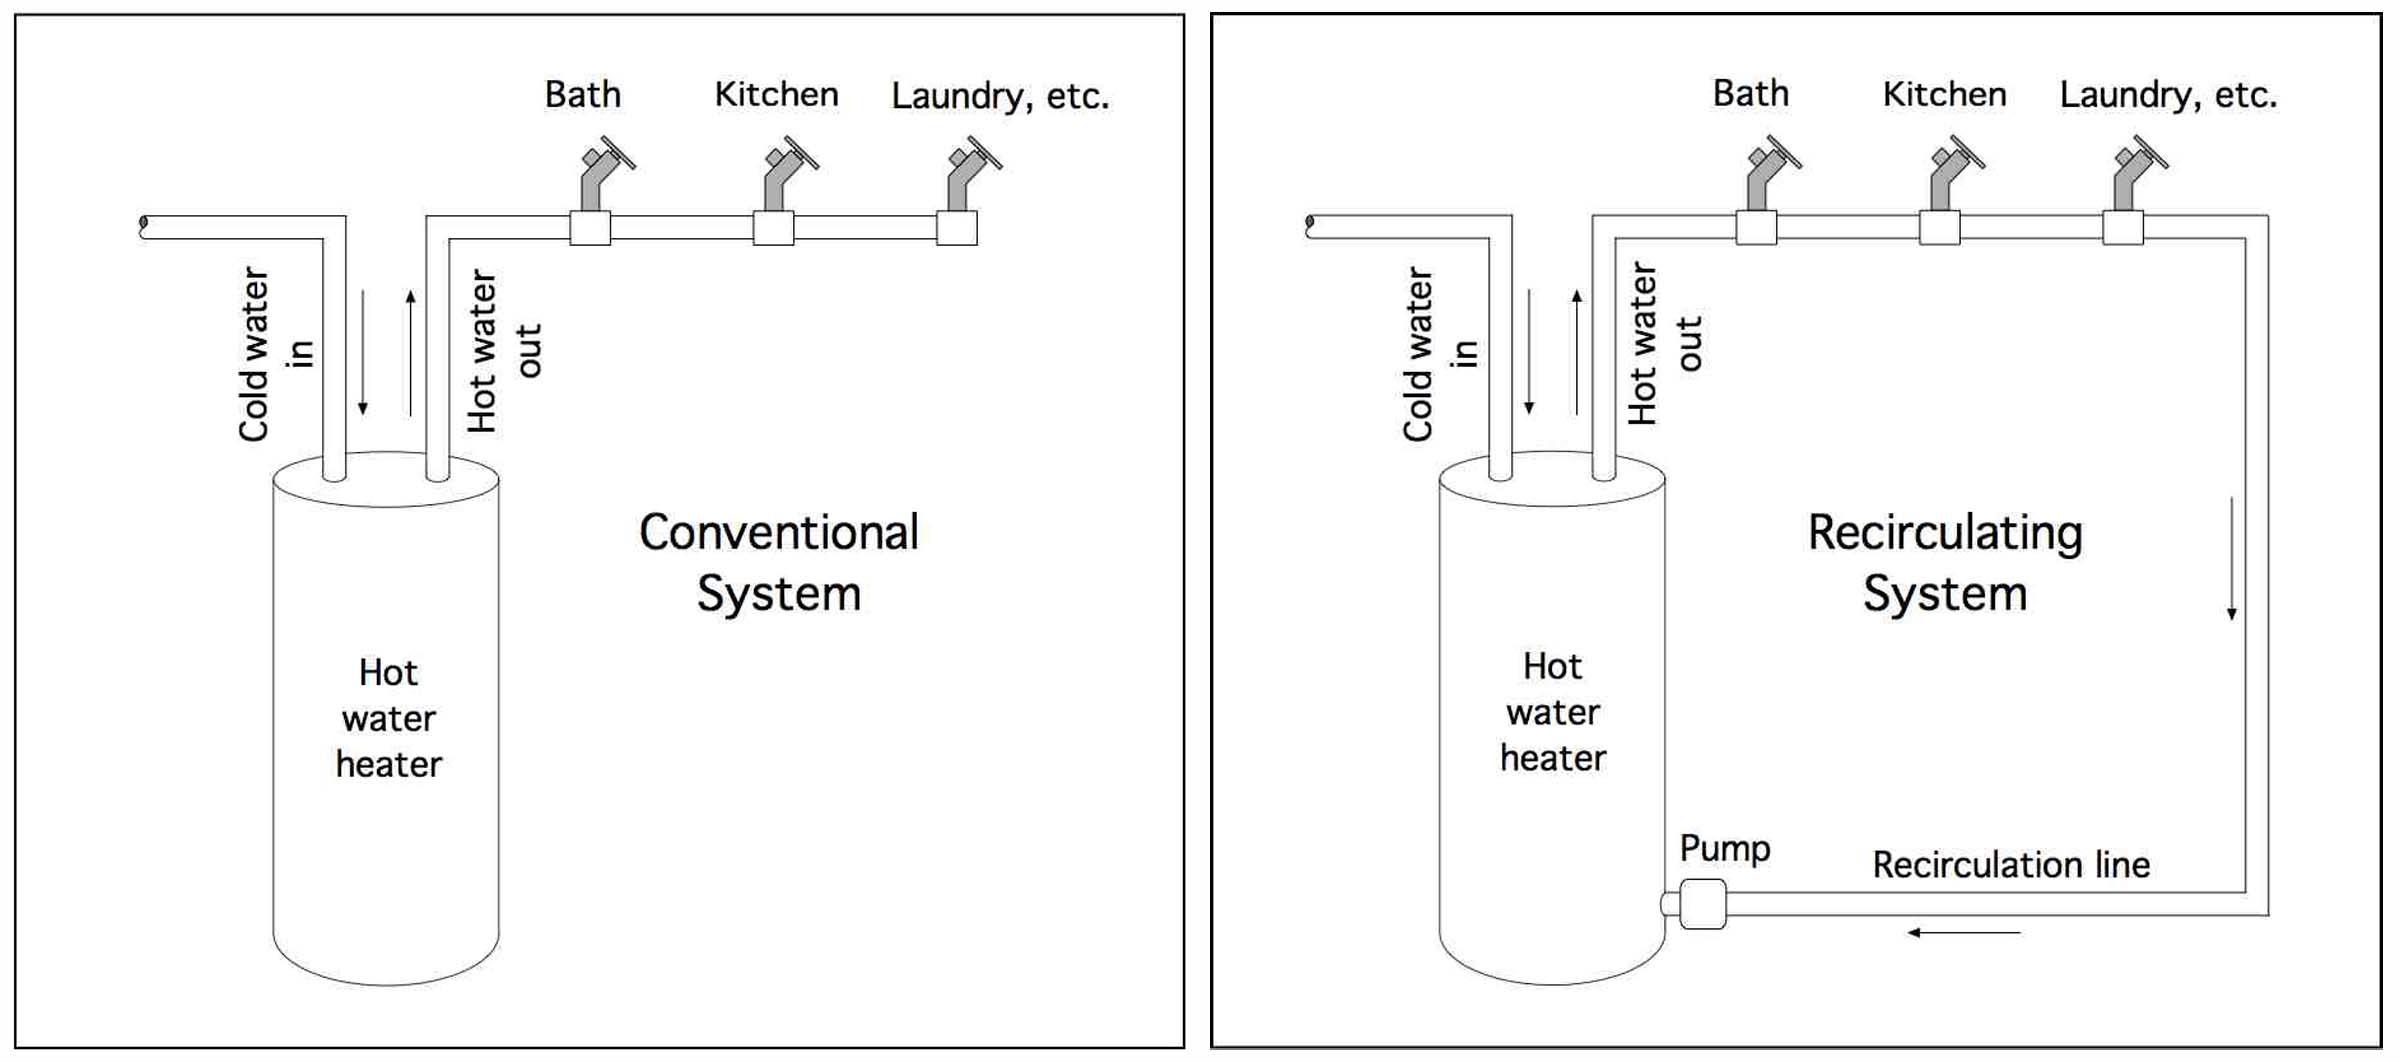
The diagrams below illustrate the difference between a conventional,
and a recirculating system:
A question arises about the cost of running the system -- the length of
piping and associated heat loss is nearly doubled when compared to a
conventional layout. More importantly, a constant flow of water
from the hot water heater is exposed to this loss whenever the pump is
running.
An estimate of costs can be made from power usage distributions: In
addition to displaying distributions of power generated by our solar
panels and power provided by the grid, the eGauge Solar Power Monitor
makes it possible to plot a separate distribution of the power used by
our household.
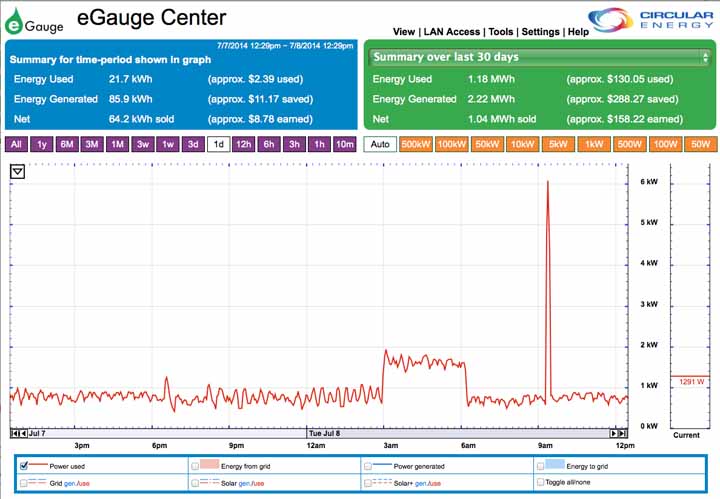
1. Baseline
To establish a baseline, we first show the distribution of power used
starting at about 12:30PM on Monday, 7 July 2014 and ending 24 hours
later, during which time the house was unoccupied and the recirculation
pump was turned off.
Three major levels of energy use are evident from this graph:
- For most of this time energy use fluctuated at a
“maintenance” level somewhat below 1 kW, representing power used
by appliances such as refrigerator, freezer, security system,
electronic standby power, etc,
- During the period between 3:00 – 6:00 AM the pool
filter pump temporarily raised the background level another .75kW, and
- Starting at about 9:15 AM a 6 kW peak occurred
when the hot water heater went on. We assume the duration and
amplitude of this peak to be characteristic of system heat loss.
Next we look at energy use distribution with the recirculating system
in use. The recirculating pump can be activated in one of two modes,
each of which has different power requirements:
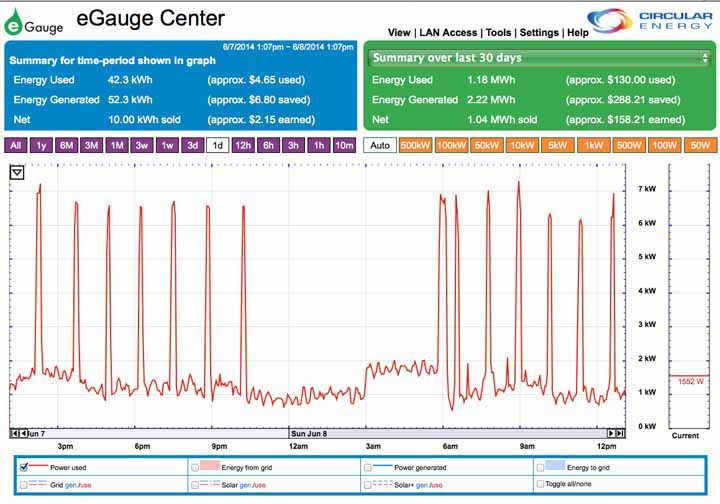
2. Continuous Mode
In this mode the pump runs continuously during the day, but is timed to
shut off at night when little or no hot water is used, between 11:00PM
and 5:45AM. The figure below graphs power used in continuous mode,
starting at about 12:30PM on Saturday, 7 June 2014 and ending 24 hours
later, during which time the house was occupied and the recirculation
pump was running. This distribution is typical of a summertime day when
major energy-dependent appliances such as the clothes dryer and air
conditioning are not being used.
Superimposed on the background pattern shown in the baseline figure are:
- Highly variable increases over the maintenance
level during active daylight hours when more smaller appliances are
used, and
- 14 prominent peaks that correspond to the times
the electric hot water heater is on. These peaks recur about once every
hour and a quarter except for the 6.5-hour period between 11 PM Sunday
and 5:45 AM Monday during which time the timer shut off the
recirculation pump and electric power usage returned to the maintenance
level. The duration of each of these peaks is about 10 minutes.
Over a 32-day period of continuous mode operation,
the average number of peaks per day was 14.1. Peaks were counted only
if they had the characteristic shape associated with system heat loss
recovery and were not associated with surges resulting from major
appliances use.
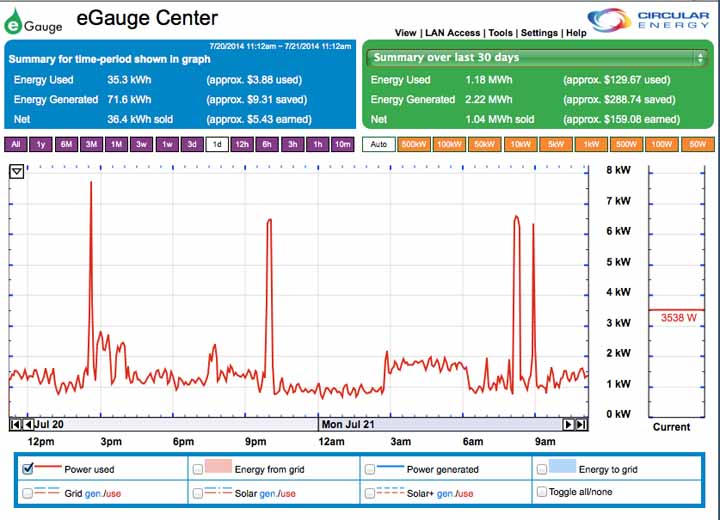
3. On Demand Mode
The house is wired so that a 30-minute timer switch is located near
each of the bathroom, kitchen and laundry faucets. A turn of the knob
on one of these switches activates the recirculating pump, producing
hot water in a few minutes. The delay is similar to that of a
conventional non-recirculating system, but no water is wasted.
The figure below shows a typical distribution of energy use with On
Demand pump activation.
Here, four peaks characteristic of system heat loss recovery are seen.
This distribution is typical of energy use with on demand pump
activation, again in the absence of major appliance use.
Over a 44-day period of On Demand mode operation, the average number of
peaks per day was 4.6. Here too, peaks were counted only if they had
the characteristic shape associated with system heat loss recovery and
were not associated with surges resulting from major appliances use.
Clearly, recirculation accounts for a measurable consumption of energy.
The water heater is a 5.5kW model, so given its 10-minute duration,
each peak represents about 0.92 kWh of energy used. For the year
2013, CPS’s average cost per
kilowatt hour was $0.11. (As an aside, owing to energy generated by our
solar power system, the net
cost at our house for that year was $0.04 per kWh.)
The table below summarizes estimates of hot water recirculation costs
on a daily, and on a yearly basis:
|
Per
Diem
|
Per
Annum
|
|
Peaks |
kWh |
CPS |
Our Net |
kWh |
CPS |
Our Net |
| Baseline |
1.0 |
0.9 |
$ 0.10 |
$ 0.04 |
335 |
$ 37 |
$ 14 |
| Continuous |
14.1 |
12.9 |
$ 1.42 |
$ 0.52 |
4717 |
$ 519 |
$ 190 |
| On Demand |
4.6 |
4.2 |
$ 0.46 |
$ 0.17 |
1539 |
$ 169 |
$ 62 |
The table suggests the following:
- There is a small CPS cost ($ 37) from system heat losses even in
the absence of recirculation.
- On Demand operation costs about 1/3 that of continuous mode.
- Continuous operation of recirculation is relatively expensive
even at our net cost. This amount ($ 190) represents about 13% of our
total net electric charges for the year 2013.
Some observations are in order:
- The recirculation pump itself uses 0.08 kW per hour when running.
This translates to 1.4 kWh for the 17.5-hour day that it runs in
continuous mode, or 511 kWh per year. Annual cost to run the pump
in continuous mode is thus about $ 56 at CPS rates ($ 20 at our net cost); in
either case about 10.5% of the total. In On Demand mode, assuming
that local timer switches are set at their maximum 30 minutes 4.6 times
per day, the annual pumping costs are about $ 7.40 at CPS rates ($ 2.60
at our net cost), or about 4% of the total.
- We can make a tentative effort to generalize this analysis: The
total length of the 3/4" XLPE piping in this house is estimated to be
about 300 feet (insulation meets R3 minimal residential hot water pipe
code
requirements). This implies an annual power loss per foot of piping of about 15.7 kWh, costing
$ 1.73 at CPS rates. There
is no guarantee that these numbers will apply to other housing, since
building dimensions, materials, climate
and patterns of use are all determinants of energy loss and its costs.
Nonetheless, it should be
evident that hot water recirculation systems are not cost free.
- I do not know if heavier insulation would decrease system
heat loss enough to pay for itself in any reasonable length of time.
- The number and duration of wintertime peaks may
exceed those shown here, owing to increases in piping heat loss with
cooler crawl space temperatures. If ambition permits, I may check
this some time during winter months.
- PLEASE NOTE: I have done my
best to check the accuracy of the tables and calculations on this page.
Further, the conclusions and assertions made are intended as guidelines
and may not apply to situations other than the setting described here. Thus, I must assert the usual
disclaimer that the information presented here is distributed without
warranty, and that you use it at your own risk.